Some problem can be investigated reading log files on thin client or generating log over network (and captured by ThinMan).
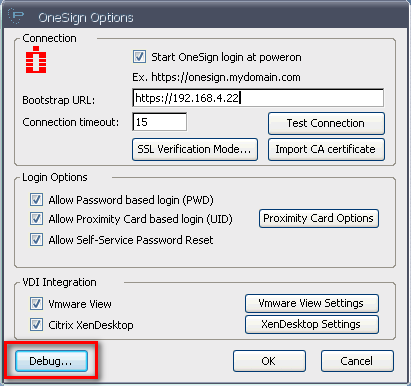
You can specify all debug options clicking on "Debug" button in "Imprivata OneSign" window. It will open a new window with Debug options.
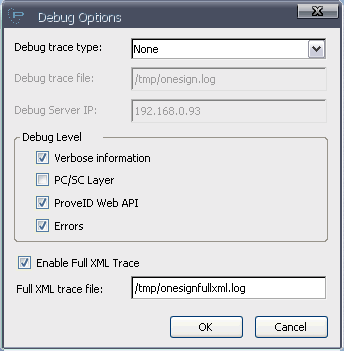
In this window you are able to define which debug trace type use to log events: it can be "None", "File" or "UDP Packet". In case of "None" no debug information are traced. See below for other cases.
In the "Debug Level" section you can define which events collect in the log.
You can also flag "Enable Full XML trace" option: this tell the thin client to trace all XML communication between thin client and the Imprivata appliance and to save in the file defined in the next field (see also below for information about saving it on USB Mass Storage Key).
Trace information are not collected if you set "Debug Trace Type" to "None" and unflag the "Enable Full XML Trace" option.
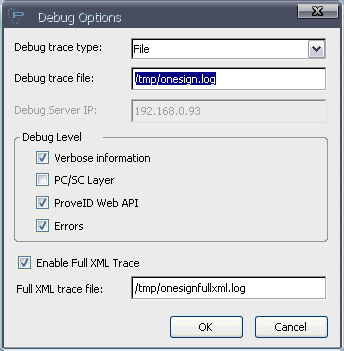
If you set "Debug trace type" to "File" you have also to define the filename and path where log information are wrote. Filename can be stored in local thin client file system (e.g. "/tmp/onesign.log") or on a USB mass storage key. In the second case put a Usb Key in the thin client, the thin client will mount the Usb Key in the file system and visualize it in the desktop. Under the icon you will find the name of the mounted USB Key.
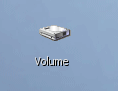
The Usb storage is mounted under "/tmp/mnt/" directory succeeded by the name of the Usb Key. E.g. in this case the path will be "/tmp/mnt/Volume/" (beware that pathname is case sensitive and will use "/" (slash) character as separator for directory), so a possible file name to provide can be "/tmp/mnt/Volume/onesign.log".
Tip
If you plug on the thin client only one USB Key another possible directory pathname for it is "/mnt/disc1" that is not dependent from the name of the USB key. In this case the log file could be "/mnt/disc1/onesign.log".
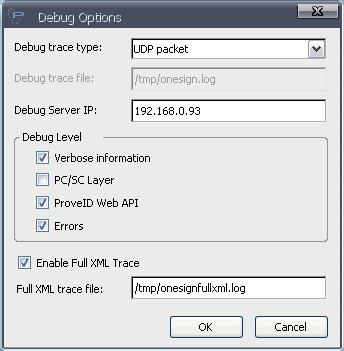
Other possible "Debug trace type" can be "UDP Packet". In this case is requested an IP Address where log information are sent. Insert the ThinMan Server IP Address, save the configuration and restart the thin client. Now follow this instruction on ThinMan Server to configure it.
¶ On the ThinMan Server
Access the folder where ThinMan is installed (typically "C:\Program Files\Praim\ThinMan").
Double click on "NetOpenTracer.exe" file. It will show the following window:
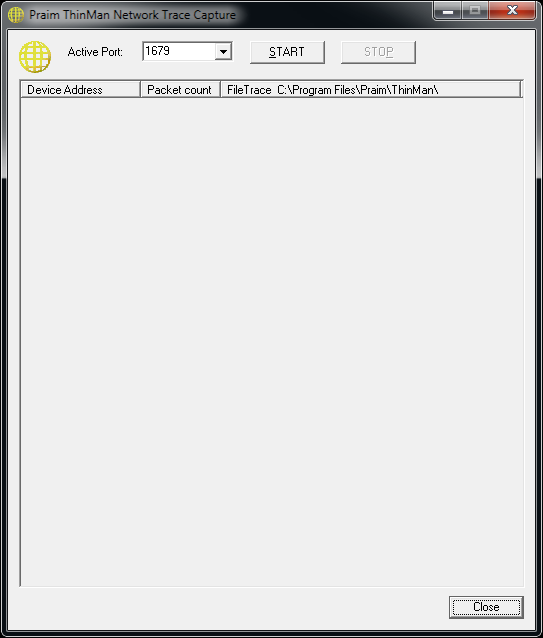
Click on "START" button to active the log collection.
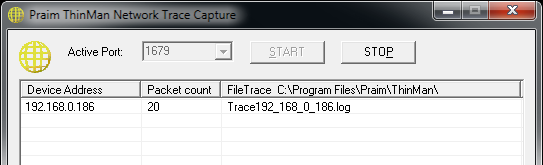
Once the thin client start sending log information you will find a new line with device address, number of packet received and the log filename where log information are stored (path is visualized in the column title, e.g. "C:\Program Files\Praim\ThinMan").
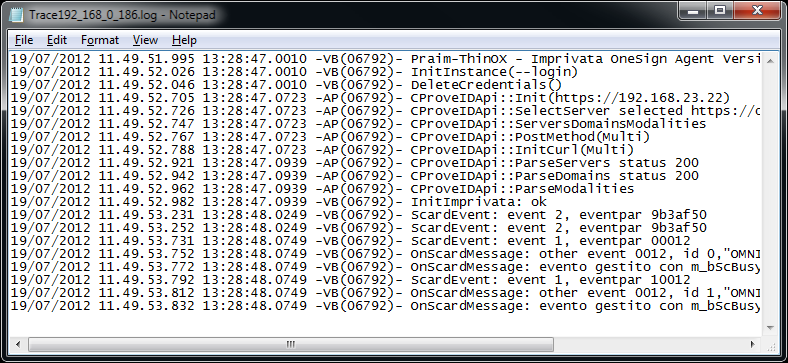
Double-Clicking on the filename will open the log file.
Once the trace information are collected you can close the "Praim ThinMan Network Trace Capture" clicking on "Close".